Transaction Cost Analysis


Filters
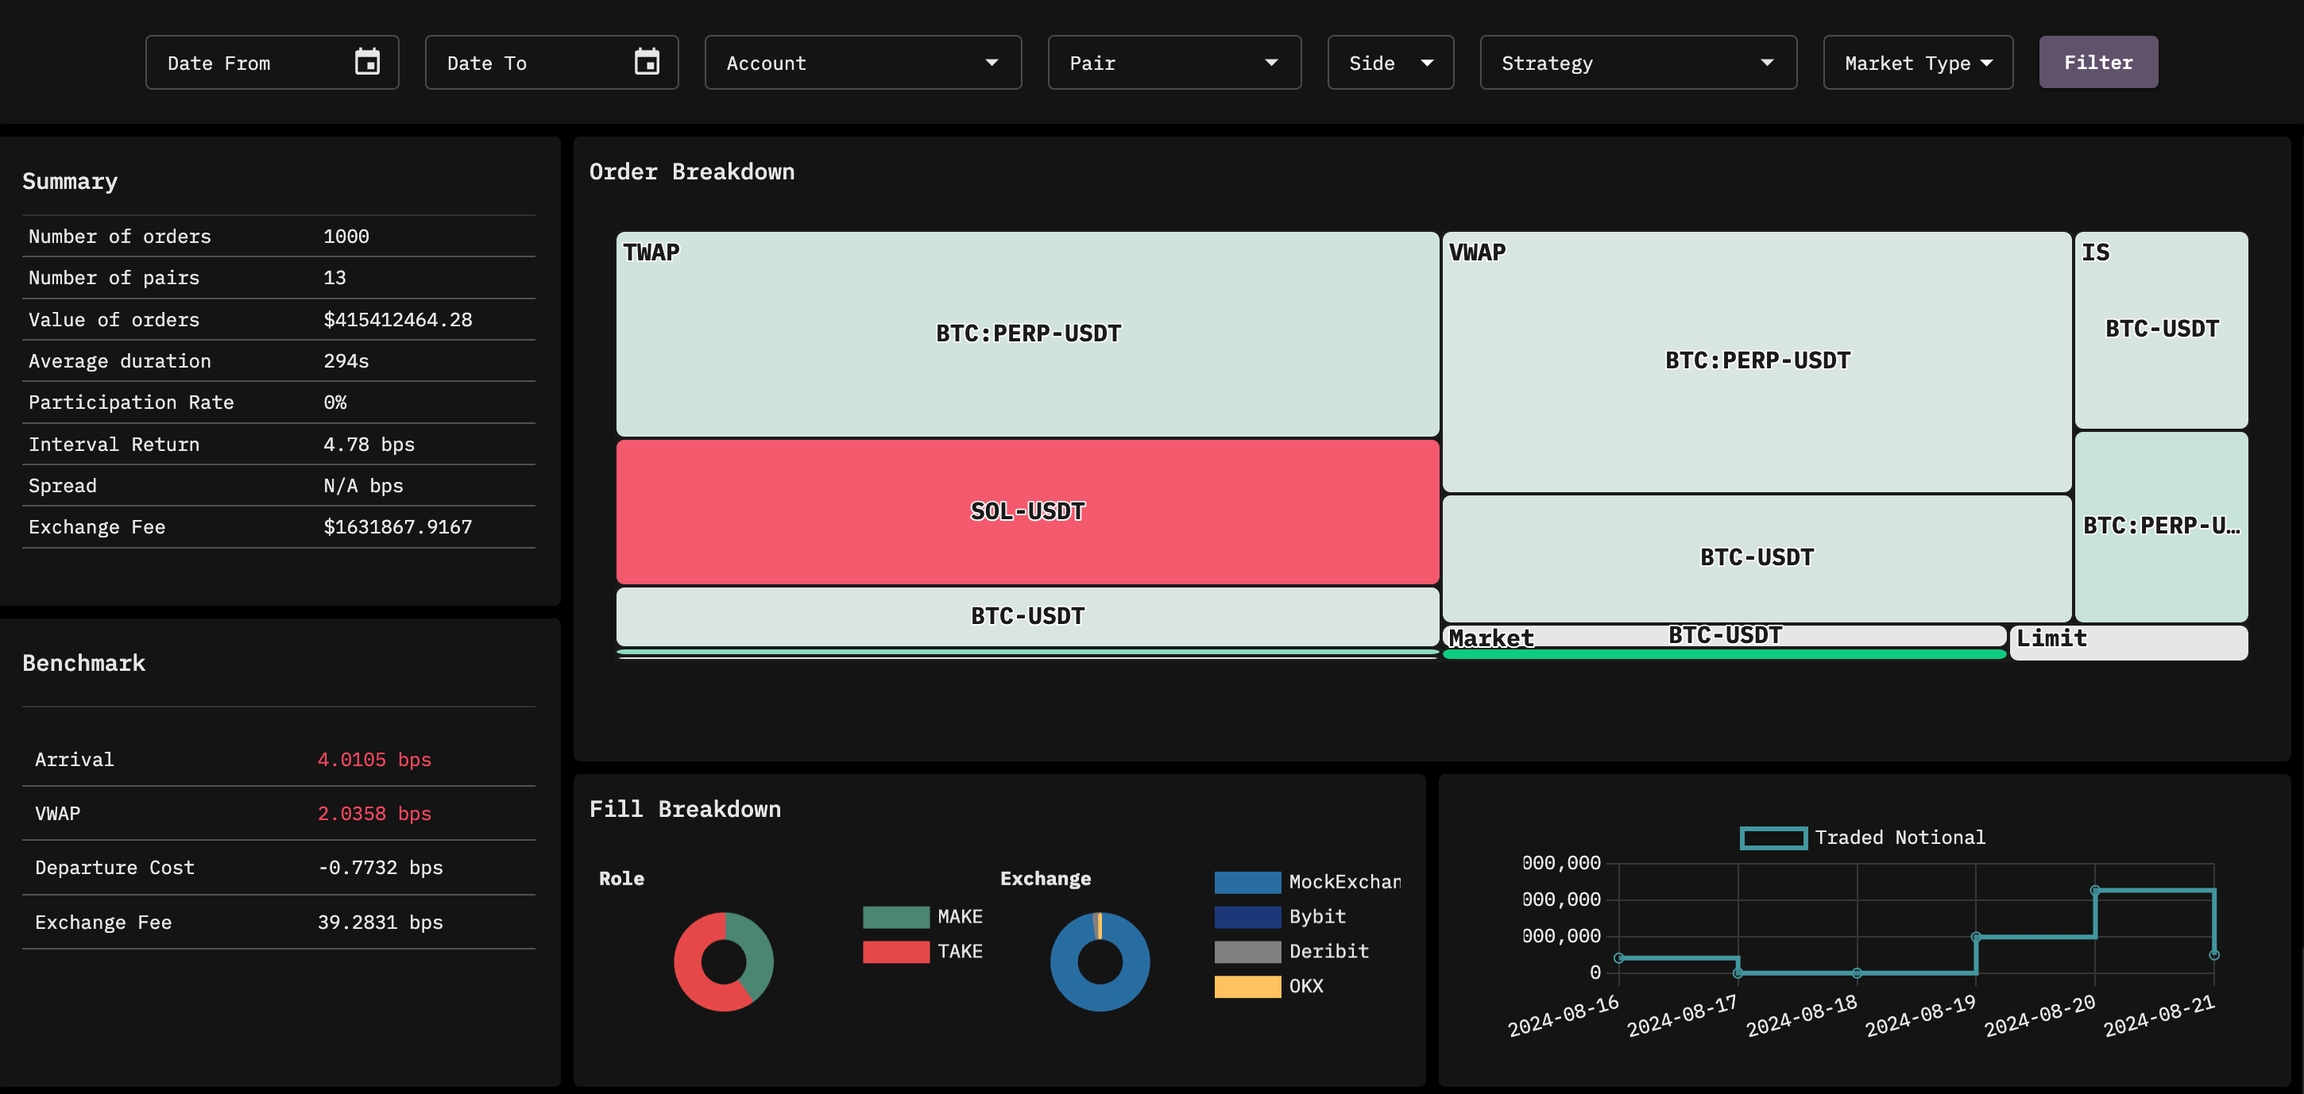
The filter fields (date, account, pair, side, and strategy, and market type) at the top of the page apply to all the data visualizations on this page.
Summary
Number of Orders
Number of orders
Number of Pairs
Number of unique pairs traded
Value of Orders
Sum of notional traded value of orders
Average Duration
Notionally weighted average of order duration
Participation Rate
Share weighted average of executed quantity / market volume
Interval Return
Notionally weighted average log return of arrival price vs departure price
Spread
Notionally weighted average spread of name
Exchange Fee
Sum of notional exchange fees
Order Breakdown
Notional breakdown of each token bought/sold and strategy used, colored by the notionally-weighted arrival slippage.
Fill Breakdown
Notional breakdown of fills that acted as maker or taker across all orders
Notional breakdown of exchanges that were used
Timeseries Traded Notional
Shows the total notional traded by day of order entry
Benchmark Costs
For all costs, negative (green) means the algorithm beat the benchmark and positive (red) means the algorithm incurred costs relative to each benchmark.
Arrival Cost
Notionally-weighted, side-adjusted natural logarithm of executed price divided by arrival price. Arrival cost can show the shortfall in prices between the investment decision and execution.
VWAP Cost
Notionally-weighted, side-adjusted natural logarithm of executed price divided by VWAP. VWAP costs can show how well the algorithm tracked market volume and show relative fill quality versus the weighted average price of the market during the order duration.
Departure Cost
Notionally-weighted, side-adjusted natural logarithm of executed price divided by departure (last) price.
Exchange Fee
Notionally-weighted exchange fee divided by traded notional. This shows the average exchange fee paid to help monitor exchange fee benefits.
Order Size Distribution
A histogram of the number of orders, broken out by side, in a range of notional value or participation rate buckets.
Arrival Slippage
A visualization of the distribution of orders' slippage from arrival price, normalized as a z-score, that is, the number of standard deviations away from the mean arrival slippage.
VWAP Slippage
A visualization of the distribution of orders' slippage from VWAP, normalized as a z-score, that is, the number of standard deviations away from the mean VWAP slippage.
Was this helpful?