> For the complete documentation index, see [llms.txt](https://docs.tread.fi/llms.txt). Markdown versions of documentation pages are available by appending `.md` to page URLs; this page is available as [Markdown](https://docs.tread.fi/order-tracking-and-portfolio-management/real-time-algo-order-tracking.md).

# Real-Time Algo Order Tracking

<figure><img src="/files/Kljw6GHBqtHuUhq4poOk" alt=""><figcaption><p>Algo Order Tracking Dashboard Interface</p></figcaption></figure>

The dashboard provides real-time insights into an order’s execution, allowing users to track performance and market interaction as the trade progresses.&#x20;

You can access this by clicking the magnifying glass from your order table:

<figure><img src="/files/hFqPsIG5EgZ3xs9o9ScW" alt=""><figcaption></figcaption></figure>

### Execution Statistics

<figure><img src="/files/x5XAQ2LP6ch7whPm6kRJ" alt=""><figcaption></figcaption></figure>

<table><thead><tr><th width="178">Benchmark</th><th>Description</th></tr></thead><tbody><tr><td><strong>Slippage</strong></td><td>Side-adjusted natural logarithm of <em>executed price</em> divided by <em>arrival price</em>. The arrival price is the mid quote at the time of order submission. The benchmark price will not change as the order progresses and the realized cost will be a reflection of as-of volume weighted executed prices compared to the arrival price.</td></tr><tr><td><strong>VWAP Slippage</strong></td><td>Side-adjusted natural logarithm of <em>executed price</em> divided by <em>VWAP.</em> As the order trades, VWAP is a dynamic benchmark price that reflects the as-of volume weighted average price of all market trades that print on the selected exchanges from order entry to current time. The VWAP cost will be a reflection of as-of volume weighted executed prices compared to the VWAP benchmark price.</td></tr><tr><td><strong>Exchange Fee</strong></td><td><em>Exchange fee</em> divided by <em>traded notional</em>. </td></tr><tr><td><strong>Participation Rate</strong></td><td>The value column contains the cumulative market volume. The Benchmark column is the current participation rate (executed volume divided by cumulative market volume). </td></tr></tbody></table>

**Execution Trajectory Chart (Fixed-Duration Orders)**

<figure><img src="/files/HVNc3cF8nkLJReEIylqE" alt=""><figcaption></figcaption></figure>

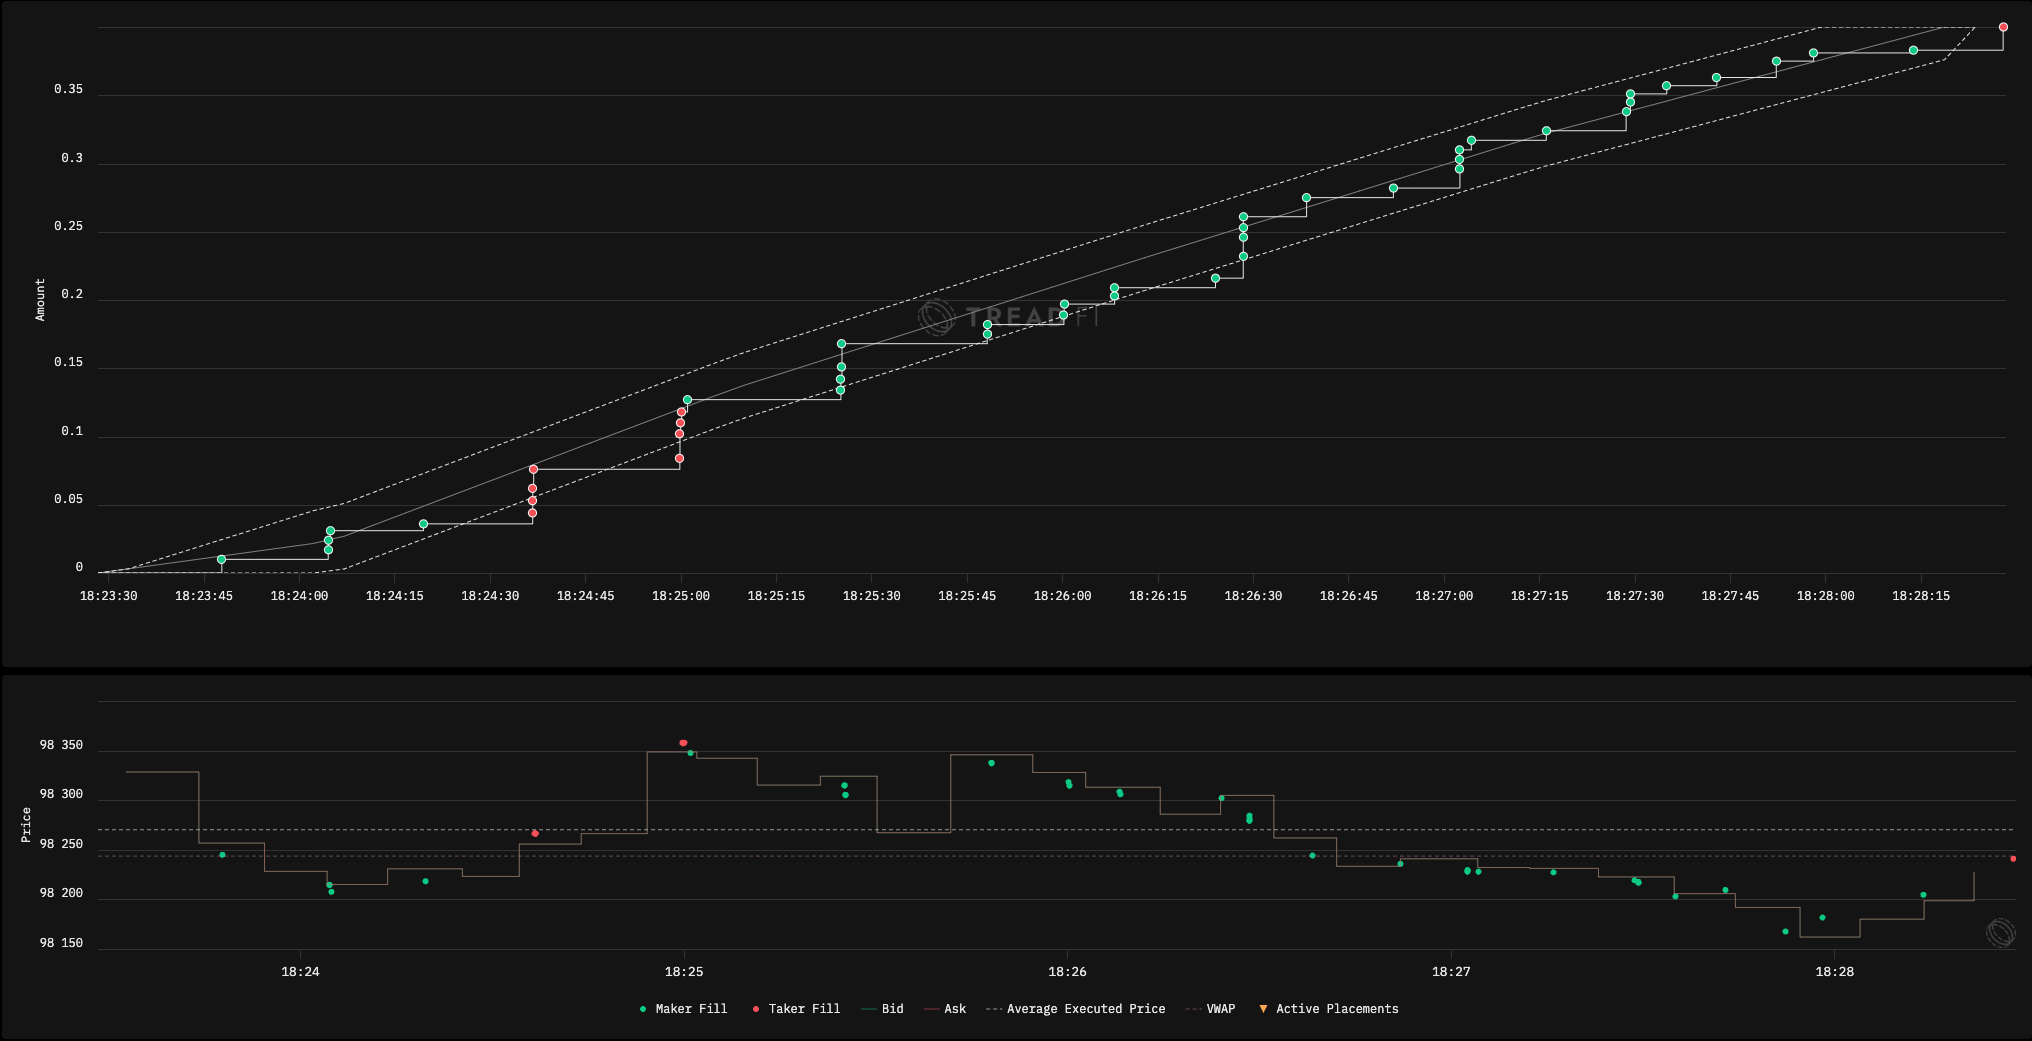
For fixed-duration orders, the execution schedule chart displays the planned execution quantity (grey) along with the upper and lower discretion bounds (dashed lines). The actual cumulative fills are represented by a solid white line, tracking how the order is executed over time. Each fill is marked with:

* **Green** - Passive (maker) fill
* **Red** - Aggressive (taker) fill
* **Orange Square** - OTC fill
* **Orange Triangle** - Active placement pending execution

**Participation Rate Target Orders**

<figure><img src="/files/YNlMciqZfj2UF7tv9yah" alt=""><figcaption></figcaption></figure>

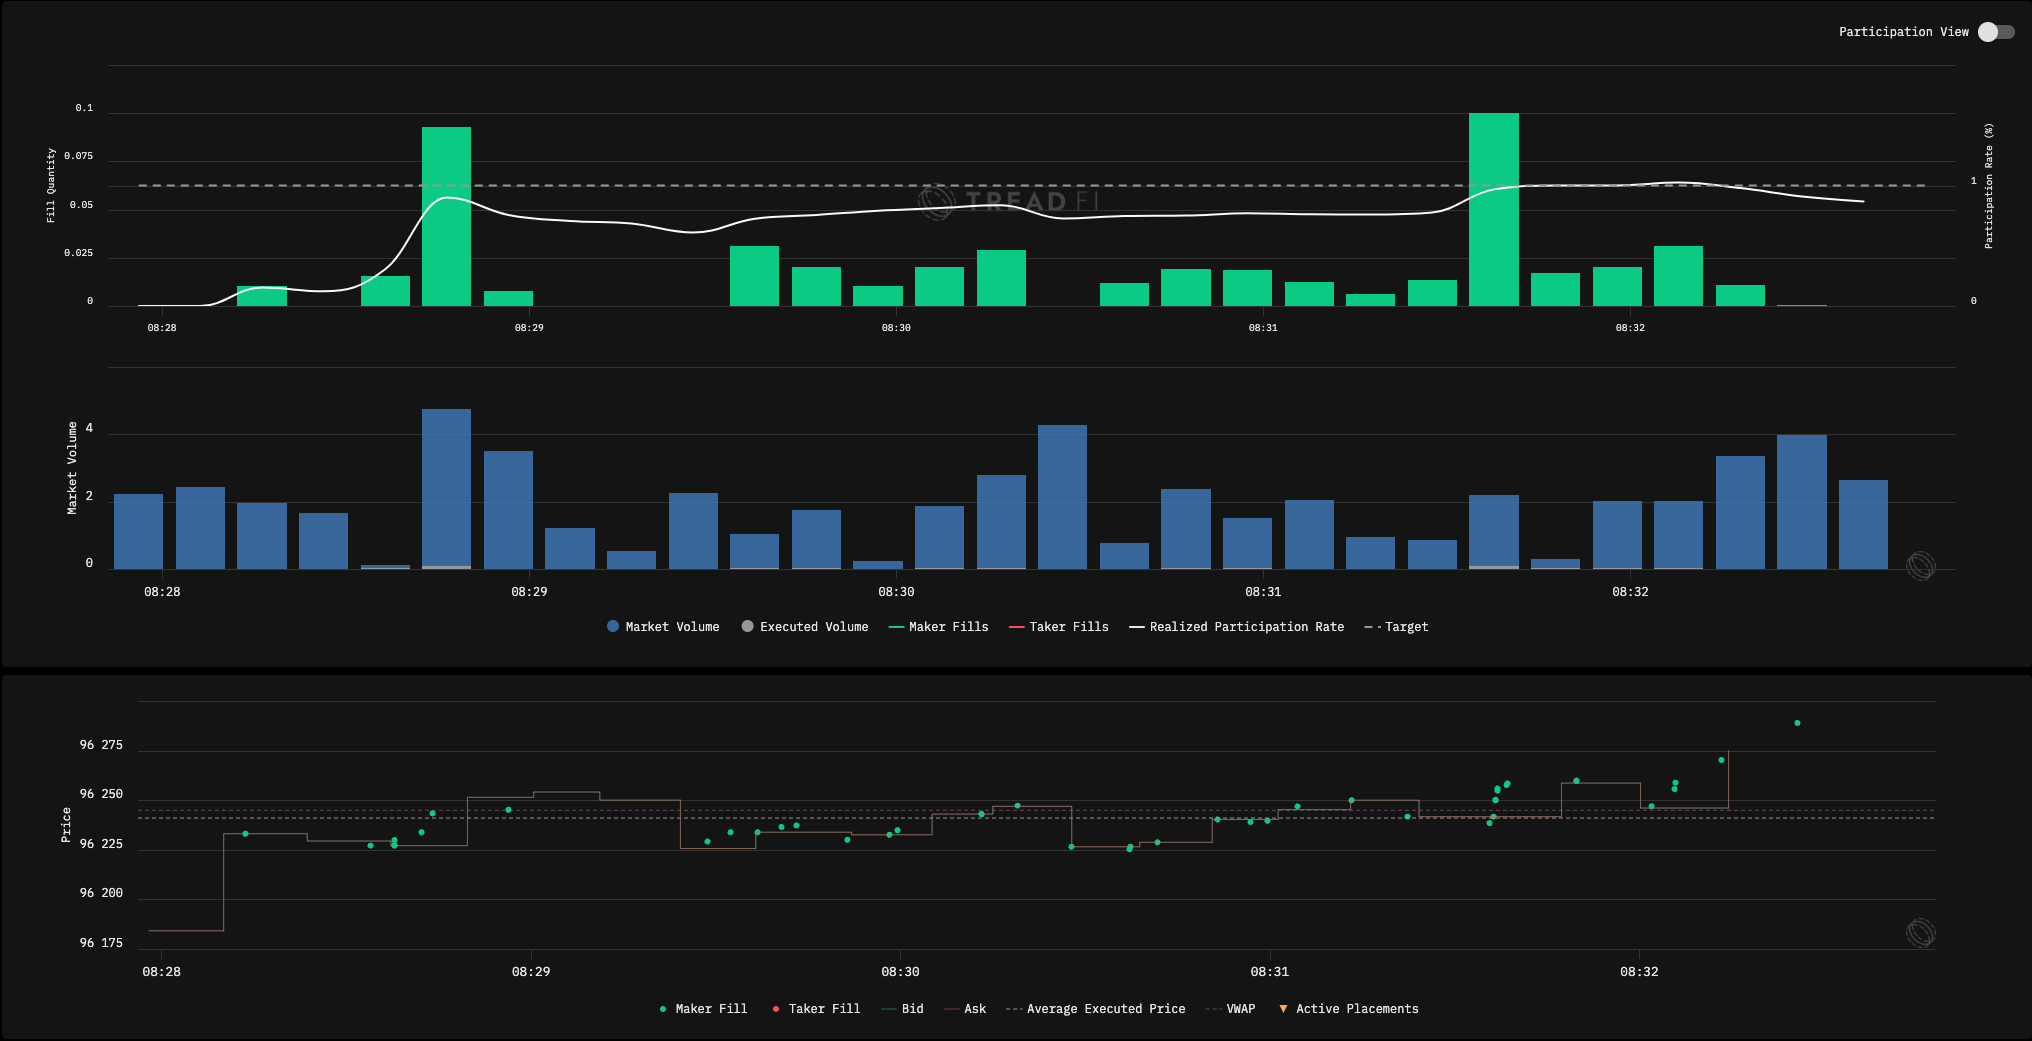
For orders using a participation rate target, the order viewer presents a breakdown of executed volume, cumulative realized participation rate, and market volume for context. Users can toggle between this view and the schedule-based execution chart.

**Price Chart and Execution Context**

For trades executed in version 1.4.3 or later, the price chart illustrates where fills occurred relative to the bid-ask spread during the order’s duration. The chart includes:

* **Dotted Grey Line** - Average executed price
* **Dashed Violet Line** - VWAP benchmark
* **Orange Line** - Dynamic limit price
* **Bid/Ask Traces** - Represented in green (bid) and red (ask); for narrow spreads, they may overlap.

This real-time execution tracking helps traders monitor their order's performance, assess market conditions, and refine execution strategies based on data-driven insights.