> For the complete documentation index, see [llms.txt](https://docs.tread.fi/llms.txt). Markdown versions of documentation pages are available by appending `.md` to page URLs; this page is available as [Markdown](https://docs.tread.fi/order-tracking-and-portfolio-management/portfolio/vcefi-verified-cefi.md).
# vCefi (Verified CeFi)
In Beta
### Overview
The vCeFi (Verifiable Centralized Finance) tab offers on-chain verified trading performance data, allowing you to share proof of your centralized exchange activity. It merges decentralized transparency with centralized efficiency, enabling you to build a verifiable trading reputation while keeping your individual positions private.
You have full control over what data to publicly show or keep private.
### Trader Profile Dashboard
The main dashboard displays comprehensive trading performance metrics:
**Performance Charts**
**Unrealized PnL Chart**
* **Displays:** Your profit/loss over time
* **Data Source:** On-chain verified trading data
* **Time Range:** Based on selected date range
* **Color Coding:** Green for profits, red for losses
**Notional Exposure Chart**
* **Displays:** Your total market exposure over time
* **Data Source:** On-chain verified position data
* **Usage:** Track how your position sizes change over time
* **Risk Management:** Helps identify periods of high/low exposure
**Cumulative Volume Chart**
* **Displays**: Your total trading activity over time
* **Chart Type:** Column chart showing daily trading volume
* **Exchange Breakdown:** Volume separated by exchange (if multiple accounts)
* **Total Display:** Shows cumulative volume for the selected period
**Key Terminology**
* **Epoch:** Time period for the proof (blockchain timestamp)
* **Volume:** Trading volume for the epoch
* **Proof:** Link to view detailed proof data
* **Share:** Generate shareable image of the proof
## Proofs Table
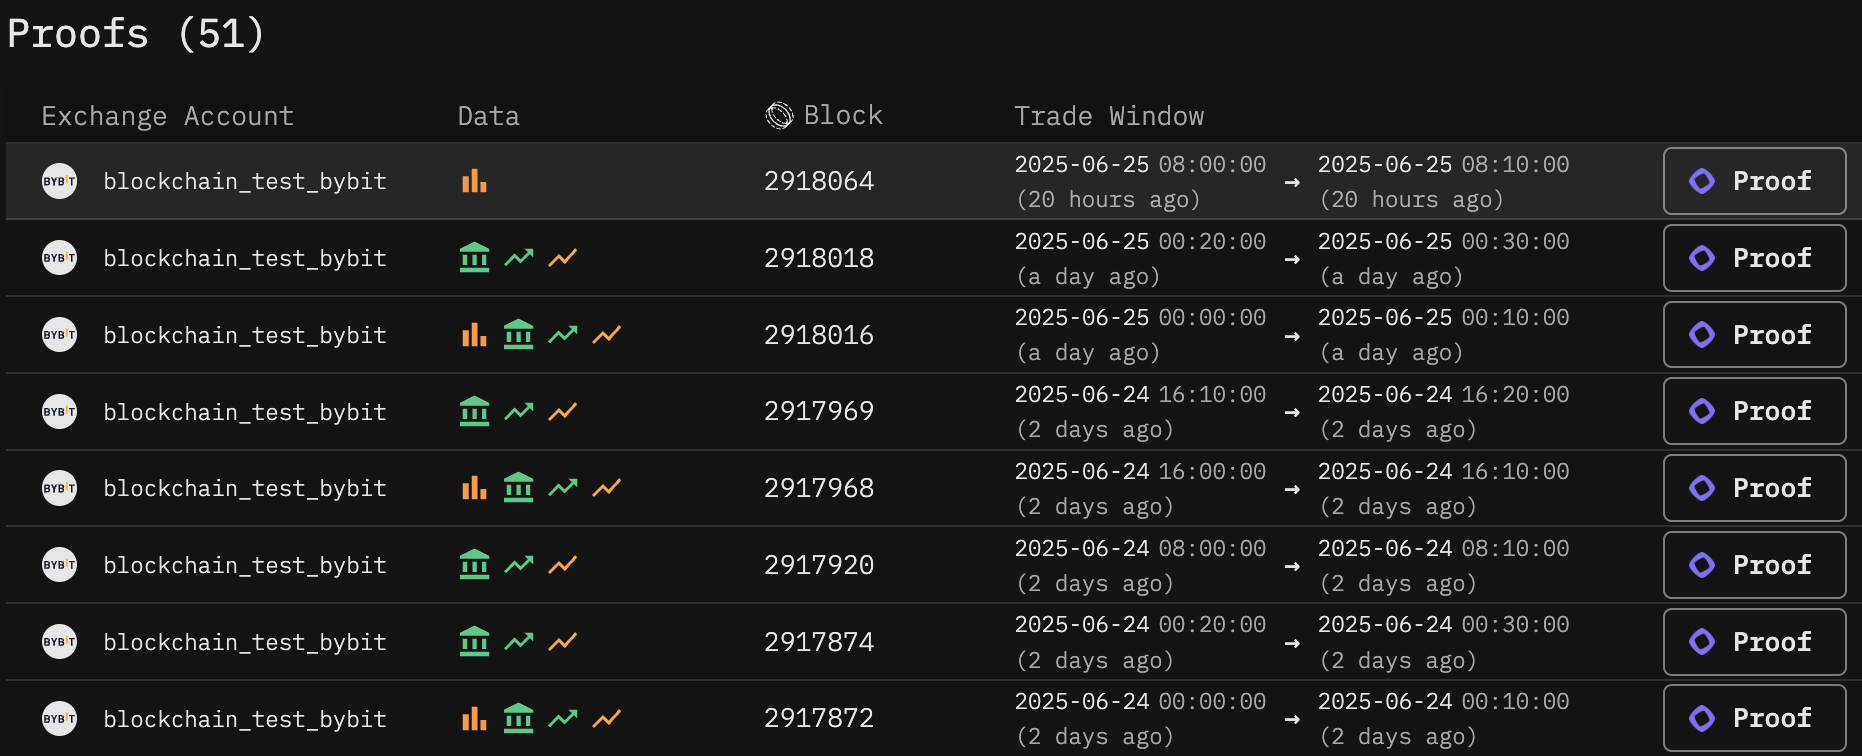
Below the charts, you'll find the **Proof Table**. This table displays your trading activity, which has been **cryptographically secured and verified on-chain**. Your trading activity is captured in **10-minute intervals**, as shown under the **Trade Window** column.
For each time interval, one or more metrics can be verified. This is indicated by icons under the **Data** column. You can hover over these icons to see which specific metrics have been verified.
To verify the trade data status for a specific window, click the **Proof button** in that row.
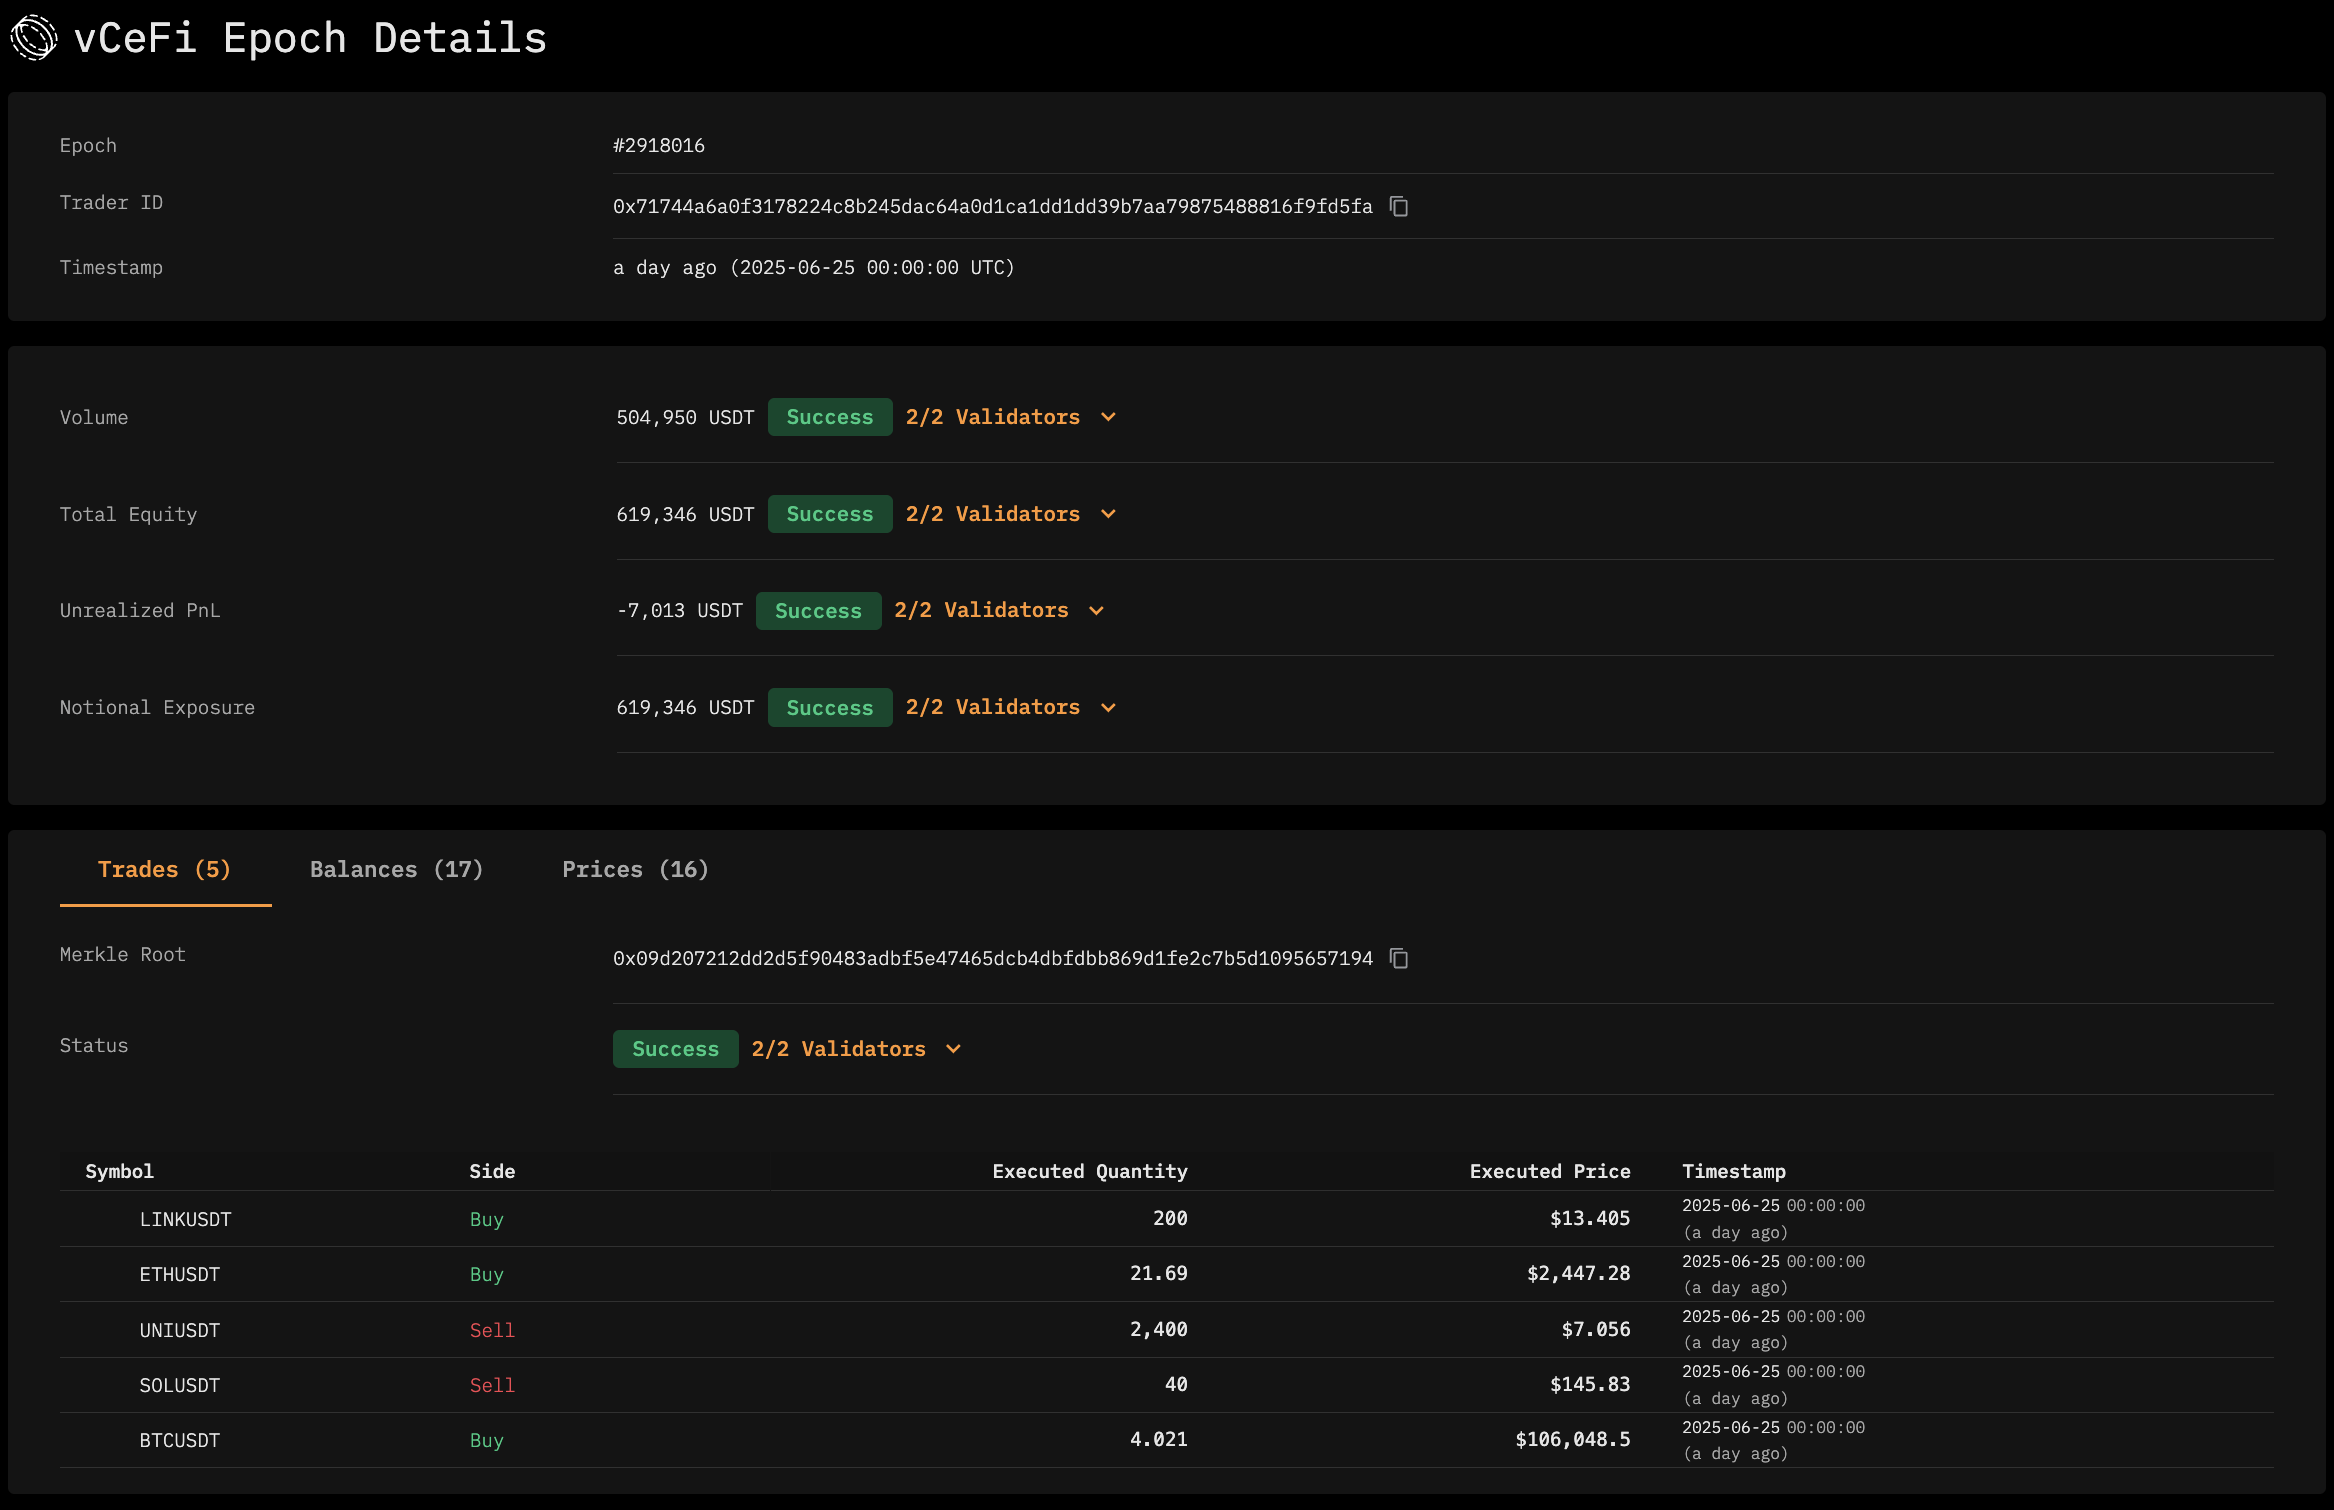
The image above shows the computed and verified metrics. It also displays the number of validators for each data point.
Expanding a metric reveals further details about its validation status and attestor information. Clicking the "Proof" button takes you directly to the transaction details on MonVision.
The lower table shows the raw trade data, balance data, and pricing data captured during this time interval. This data is used to compute the metrics displayed above.